GEOTECHNICAL ENGINEERING
LAREDO
HomeGeophysicsSeismic tomography (refraction/reflection)

Seismic Tomography in Laredo – Subsurface Imaging with Refraction & Reflection

Knowledgeable. Thorough. Resourceful.

LEARN MORE

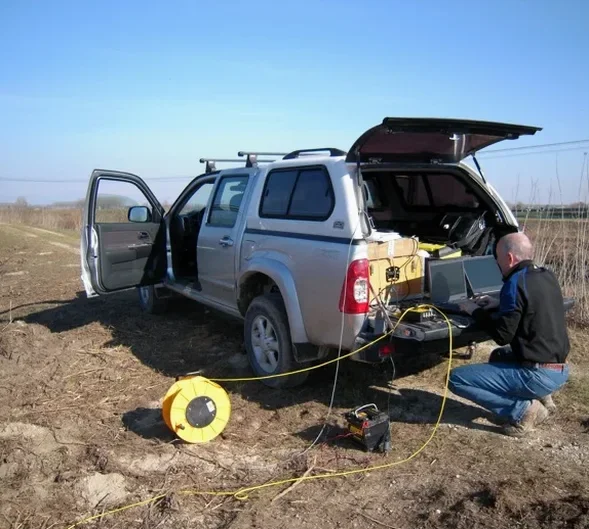
The geophone spread runs 115 meters across a vacant lot off Mines Road, 24-channel cable snaking toward a sledgehammer source. Each hit stacks five times. The seismograph records P-wave arrivals in microseconds, building a velocity model of what lies beneath Laredo’s caliche caprock. Seismic tomography in this part of South Texas has to contend with a tricky near-surface: dry, fractured limestone over saturated silts, then the Carrizo-Wilcox aquifer at depth. Refraction catches the shallow velocity contrast at the caliche–clay interface around 8 to 12 feet. Reflection sections image deeper, down to 100 feet, where the Laredo Formation sandstone dictates bearing capacity for deep foundations. Crews here work year-round, but summer surveys start at 6 AM before the heat pushes 105 degrees and surface noise from truck traffic on I-35 degrades data quality.

A refraction tomogram in Laredo can distinguish competent caliche from fractured caprock in a single afternoon, giving the structural engineer a continuous bedrock surface elevation to 0.5-foot accuracy.
Our service areas

Methodology and scope

The Rio Grande river terrace geology under Laredo creates a layered velocity profile that seismic tomography resolves with precision. Near-surface caliche, a secondary calcium carbonate crust formed in semi-arid climate, shows P-wave velocities of 2,500 to 3,800 m/s. Below it, the Laredo Formation claystone and sandstone units transition from weathered to competent rock between 15 and 35 feet depth. A standard penetration test at the same grid point calibrates the seismic velocity to N-values, anchoring the tomogram to real soil behavior. Refraction surveys here use 24- or 48-channel arrays with 5-foot geophone spacing to map the water table and top of bedrock continuously across a site. Reflection acquisition deploys a 100-lb accelerated weight drop or a small explosive charge when the clay layer attenuates the hammer signal. The resulting P-wave section reveals channel sand lenses and paleo-riverbeds that can cause differential settlement in mat foundations, a concern where the soil resistivity profile also indicates lateral variability in clay content.
Seismic Tomography in Laredo – Subsurface Imaging with Refraction & Reflection
Technical reference — Laredo

Site-specific factors

A five-story medical office building on Saunders Street hit unanticipated groundwater at 14 feet during excavation. The geotechnical report had relied on six widely spaced borings that missed a buried channel sand unit. Water flooded the excavation in under two hours. After dewatering, the structural engineer ordered a refraction tomography line across the entire pad. The tomogram showed a continuous low-velocity anomaly trending northeast–southwest, exactly where the channel sand crossed beneath the planned elevator core. The foundation design was revised from shallow spread footings to drilled piers socketed three feet into the Laredo Formation sandstone. The cost of the seismic survey was roughly one-twentieth of the potential delay claim. When the site sits on river terrace deposits with known channel migration, skipping a continuous imaging method is an unnecessary gamble.

Need a geotechnical assessment?

Reply within 24h.

Email: contact@geotechnical-engineering1.org

Regulatory framework

ASTM D5777 – Standard Guide for Using the Seismic Refraction Method, ASTM D7128 – Standard Guide for Using the Seismic Reflection Method, ASCE 7 – Minimum Design Loads for Buildings, IBC Chapter 18 – Soils and Foundations

Typical values

ParameterTypical value
Survey depth (refraction)10 to 100 ft, depending on spread length
Survey depth (reflection)20 to 300 ft, useful for deep paleochannel mapping
Geophone spacing2.5 to 10 ft, adjusted for target resolution
Source typeSledgehammer, accelerated weight drop, or small explosive charge
Typical P-wave velocity range1,200 m/s (loose sand) to 4,500 m/s (competent limestone)
Recording instrument24-bit seismograph, 24 or 48 channels
Data output2D P-wave velocity tomogram, depth-to-bedrock contour map, ASCII travel-time files

Common questions

What does a seismic refraction survey in Laredo typically cost?

A standard refraction survey with a 115-foot spread, 24 geophones, and one source location runs between US$2,440 and US$3,100. A longer 230-foot line with multiple shot points and reflection processing ranges from US$3,500 to US$4,770, depending on site access and surface conditions.

How deep can seismic refraction image the subsurface in the Laredo area?

Refraction depth is roughly one-third to one-fifth of the spread length. A 115-foot spread images 25 to 38 feet deep; a 300-foot spread reaches 60 to 100 feet. Reflection surveys can image deeper, to 200 feet or more, depending on the energy source and the acoustic impedance contrast at the target horizon.

Does the caliche layer in Laredo affect seismic data quality?

Caliche is actually helpful. Its high seismic velocity (2,500–3,800 m/s) creates a strong first arrival and a clear velocity contrast with underlying clay. The refraction method maps the caliche–clay boundary very accurately. The challenge comes when the caliche is highly fractured—it scatters seismic energy and reduces penetration depth.

How long does a seismic tomography survey take on site?

A single refraction line with 24 geophones takes 45 to 90 minutes of field time, including layout, shooting, and quality checks. Processing and interpretation add one to two days. Larger grids with multiple lines and 3D coverage require one to three field days depending on the number of shot points and spread configurations.

Location and service area

We serve projects in Laredo and surrounding areas. More info.

View larger map